
There are times when our best efforts produce results that we want to be better. In fact, original equipment manufacturers (OEMs) often requires a continuous improvement approach to the product within their organizations, and this gets pushed out to the rest of the supply chain. For example, the organization may have efficiency targets each year after the launch some times as high as 6% annual reduction of cost. To accomplish this, requires reduction in time and effort to produce the products of the tier 1 and tier 2 suppliers. To accomplish these objectives requires more than just technical prowess, but full engagement of the team members. Continuous improvement efforts are used throughout the development of the product. Invariably there are things we learn as the vehicle is launched and we uncover manufacturing at volume issues, perhaps customer interaction with the product that was not known at the start. For example, the product is launched, and tier 1 supplier issues can be uncovered, as well as the OEM handling of the product that impacts the product quality. These following tools and process provides an effective approach to continuous improvement.
The approach is much more than a set of tools but a process along with an organization philosophy that empowers those doing the work. Good ideas can come from anywhere, and especially from those that are performing the work. For any approach to work, our team members need to be empowered to experiment and explore. If our team believes they are unable or not allowed to make decisions or take action, then it will not be possible to successfully proceed. In fact, there are many changes to the organization required to reap the fullest benefits of a continuous improvement approach. The list below is a condensation of Deming’s 14 points for management[1]:
| Constant purpose | New philosophy changes management to leadership |
| Cease dependence on inspection | Stop awarding business on lowest cost |
| Improve constantly | Institute on the job training |
| Leadership –to help team members and equipment to do better jobs | Drive out fear |
| Breakdown barriers between departments | Eliminate slogans and exhortations (zero defects) |
| Leadership over standards and quotas | Remove barriers to pride of workmanship. |
| Vigorous focus on education and self-improvement | Everybody is required for transformation of the company |
The real point to be made, is there is much more to this continuous improvement than the technical tools, though these are important. It is crucial to create an environment wherein the members of the team can contribute in the highest order, and not through the use of coercion and hand waving.
There are a number of tools we have in our TQM arsenal, that we use to understand the situation. There are 8 tools, some or more important than others to gleaning what is happening. Some of these tools are more complex than others, for example the control chart, but most of these are relatively easy to use and it is not inordinate to have the entire team be knowledgeable.
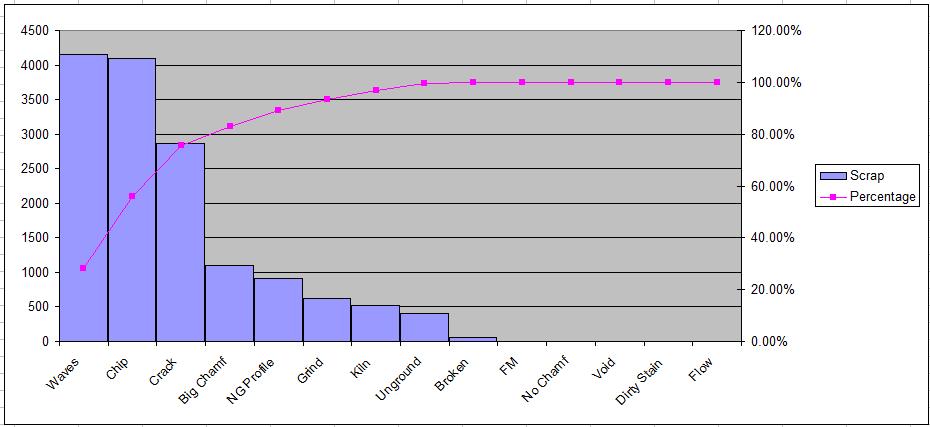
The Pareto Principle can be distilled down to the vital few versus the trivial many. Named after an Italian economist, Vilfredo Pareto back in 1895, when he noticed that 80% of Italy’s land belonged to 20% of the population. This leads us to the 80/20 rule, and it helps with prioritizing what is the most pressing of our issues. This can be based upon number of failures or by money spent. The example below shows a list of defects found in the output of a machine, we can see that waves, chips and cracks cause the team the most grief.
Scatter plots help discover possible relationship between two numeric variables. Scatter plots are presented on an x and y coordinate plane. By plotting these events, we may uncover a relationship or correlation of the points. This is where the famous phrase, correlation is not causation often originates.

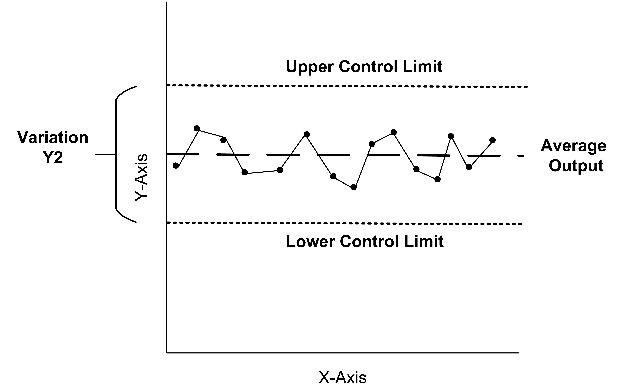
Control charts plot performance over time, comparing the status at a given point in time against the upper and lower control limits. These control limits are derived from statistics of the process performance data. The control chart gives us the visual of the variation in the system output or from the manufacturing equipment. If the variation is beyond what we find acceptable, out team may set actions (see the process) to improve, by that reduce, this variation.
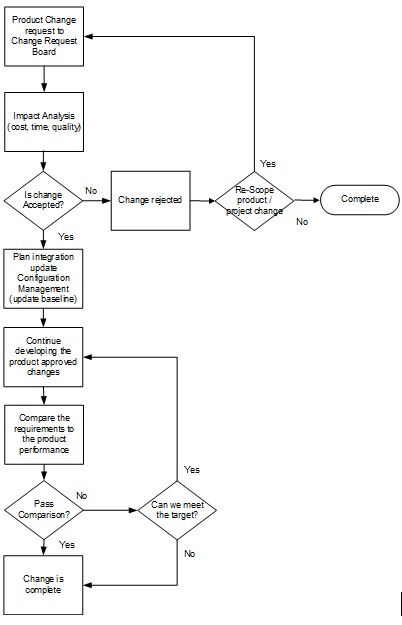
Flow charts are used to describe the flow of work including decisions. The ability to visualize the way things work, make it possible to find improvement areas.
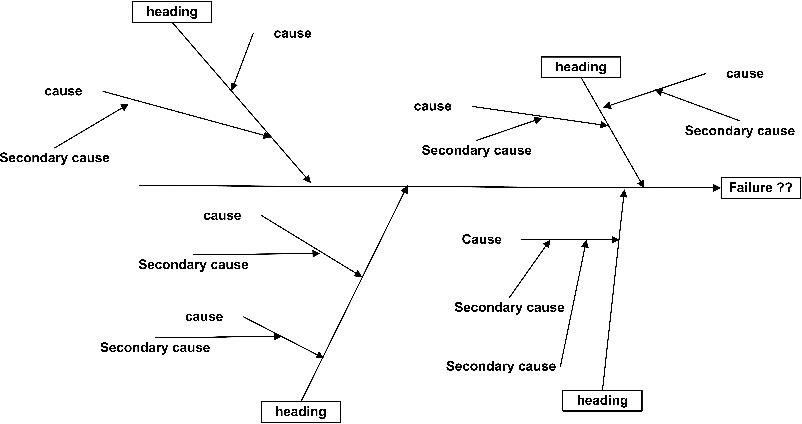
Ishikawa diagrams are used to explore possible reasons for what is being observed. The diagram is a structured brainstorming session, that relies upon the team to generate ideas that could lead to the observed symptoms. The failure symptom is placed at the head of the fish, with categories of main reasons for the failure off the back, the team will generate ideas that they believe will make the symptom occur.
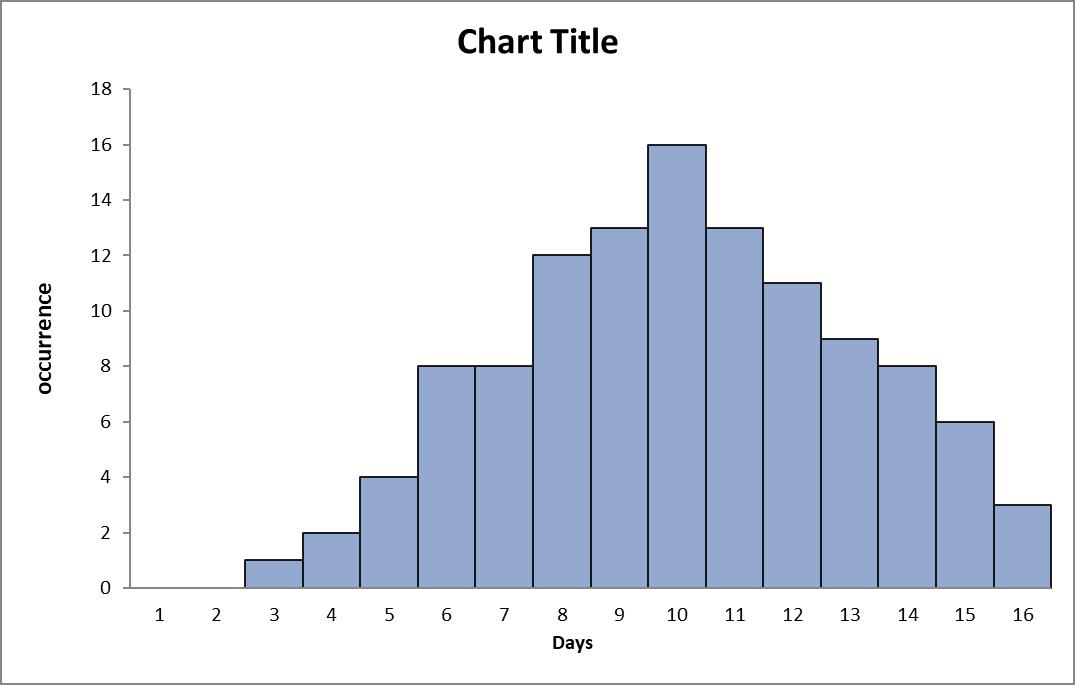
The histogram is an ordered bar chart of frequency of occurrence. Histograms are used to demonstrate distribution of a variable. From this we can determine if the article under consideration is within the range we expect, or require it to be. In the example below, we see the distribution of days that it takes to accomplish a task, the minimum amount of time it has been accomplished are 3 days, the longest being 16 days, and the most frequency of occurrence is 10 days.
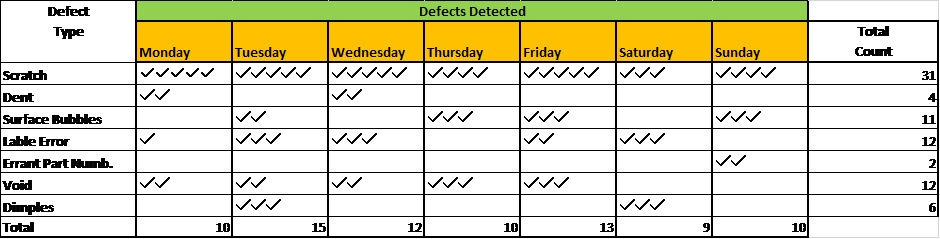
Check sheets are used to identify patterns, for example, we may start seeing scratches that show up on the that fender during manufacturing. We would then construct this check sheet to help us discover what are the causal antecedents for this symptom.
It is likely that many if not all of use know and use this tool. A checklist is essentially a line by line itemization of the activities or objectives we wish to accomplish. We may have a check list of all of the things we need to do to introduce a new product replacing and existing product, perhaps a new iteration.
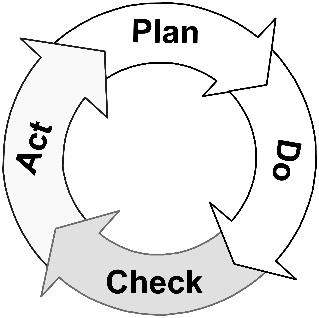
The process follows a set of steps that look much like project management. Before we can invoke the process, we will need to have some idea of what we think needs to be improved. We will need some data to start. What do we see? What is the biggest problem (symptom) that is being experienced? The TQM tools reviewed are used to uncover these abhorrent performance issues. For example, perhaps the variation in our control chart is beyond what is desired to efficiently produce the product. Once the problem symptom articulated, the choice becomes gather more data for the observed, or perhaps brainstorm (Ishikawa / Fishbone diagram) for the possible reasons. Now it is time for experimentation!
Now that we understand the objective of this effort, reduce variation of output as measured by a specific control chart. The team will set about putting together a plan for possible solutions and prioritize the most likely solution (the hypothesis). This need not be what is thought to be the best solution, or even the only solution. This is the first experiment for the team to learn it may not be the last on this topic. In the end, there will be specific predictions (specific metrics / measurements) of the outcome of the experiment.
In the do phase, we will execute that which was planned, effectively conduct our experiment. We will actually perform the process using a way that we believe will make the situation better, the new approach to the work, the new process change, will be executed as defined in the planning phase, this will include collecting the specific measurements in the way defined in the planning phase. We will use this after the work as part of our learning.
Like all closed loop control systems, we must gather feedback from the result of our experiment. Any good experiment should produce results, our hypothesis is our explanation of how things work and this experiment is what we believe will change the present outcome to the desired improved outcome. To be able to say anything tangible about the experiment, require data (metrics / measurements) from which we can compare the actual outcome to what was expected. If the outcome is not as good as the prediction, there is more learning to be acquired. Similarly, if the outcome is better than our hypothesis predicted, something is missing and we need to learn more. This may be easier explained, but will require some additional exploration. That exploration may be further analysis of existing data to include the data generated from this experiment, or the running of an additional experiment to acquire this learning.
If the experiment results are consistent with the predictions, then it is time to make this process part of the production repertoire, that is, it is no longer an experiment but time to implement the change to the production process. The word act – really should be referred to as enact – that is we enact the process from the experiment to production.
The world is full of unintended consequences. In fact, from experience, many of those unintended consequences are born from a lack of understanding of the system that is being manipulated. The tools and processes of TQM are useful for any continuous improvement program or project. In fact, these tools and techniques are so fundamental to automotive product development and manufacturing, that every engineer should have a good understanding of the process and a deep understanding most of the tools.
[1] Deming, W. E. (2018). Out of the crisis. MIT Press.


More Stories
Marquardt on the evolution of the steering wheel into a multi-sensor HMI hub
Automotive Industries (AI) Newsletter April 2025
GlobalLogic Pioneering Software-Defined Vehicles, AI Innovation, and Sustainable Solutions for the Future of Automotive Mobility