
Computer Microchips and Processors on Electronic circuit board. Abstract technology microelectronics concept background. Macro shot, shallow focus.
A multitude of factors contributed to the demand surge in the semiconductor market in late 2020 and 2021. These included post-pandemic recovery, increased demand from multiple sectors including automotive and electronics, a limited number of suppliers, and constrained capacity in the supply chain to meet the demand. These were compounded by Covid-19 impact in Taiwan, Malaysia and Philippines, port gridlocks in China and natural disasters in Asian manufacturing locations. This supply-demand imbalance had severe impacts on the automotive industry, with plant shutdowns, revenue losses of approx. $60 billion, and resulting market share loss for some companies.
However, this turbulence came with some benefits; in fact, the crunch resulted in major gains in three areas: (i) stalled capital investments were re-energized, (ii) Governments, including US and the EU, renewed their focus on strategic industry sectors and (iii) most semiconductor companies posted stellar financial results in 2021.
2021 & 2022: Years of Investments: As reported in December 2021, Semiconductor manufacturers worldwide are constructing 29 new high-volume fabs in 2021 and 2022. These fabs could reportedly produce as many as 2.6 million wafers per month, which represents roughly 15-20%* of the current output capacity. The sector is also a focus area at country level globally.
In 2021, the Biden Administration issued an Executive Order asking for a critical supply chain review for key sectors, including semiconductors and high-capacity batteries. In addition, as part of USICA, Congress has authorized close to $50 billion in subsidies for manufacturers to support supply chain resilience. In December 2021, a CEO coalition urged Congress to take swift action to fund the CHIPS for America Act and enact a strengthened version of the FABS Act.
Europe, with the European Chips Act, is planning to increase focus on chip production, with a target of producing 20% of the world’s value of semiconductors by 2030, up from 10%, according to a January 2022 report from Bloomberg. Goal is to move from being involved in research to reducing reliance on the US and China via more production.
Did financial performance and profits reflect the strong demand in 2021?
The answer is Yes and No. While cumulative revenue of the top thirty-six players in the semiconductors shows large increases consistent with price and volume increases, the average net profit margin dipped in Q2 and Q3 of 2021, before climbing in Q4. Additionally, a closer look at the Q3 2021 EBITDA and net profit margins (Fig 1) suggests industry financial performance was mixed, even during a growth year for the sector.
These could be due to (i) varied performance of sub-segments within the semiconductor sector (ii) level of integration and positioning in the value chain, (iii) number and scope of investments in R&D or facilities and (iv) debt reduction steps, during 2021. Differing processes and technologies can contribute to varying production yields, thus differing margins. If none of the above is the reason, lower margins indicate poor financial performance or financial stress for the supplier/customer.
An initial review of company liquidity via current ratios (current assets/current liabilities) also shows considerable spread across the top players (Fig 1). The range of EBIDTA and current ratios in Fig 1, even amongst the top players, suggests the need for financial analytics to assess company business risks. Going into 2022, more detailed financial analytics including for liquidity and leverage are important for assessing supplier or partner financial health, addressing potential supply crunches or delays, and resulting production constraints.
(Fig 1)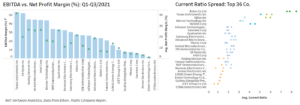
Semiconductor Trade flows in 2021:
With increasing demand, total exports from one of the leading supply countries, Taiwan, has been increasing in double digits. Exports in 2021 are almost $100 billion higher than in 2019 or 2020. Exports in electronic parts are estimated to have increased by over 50% from 2019 or pre-pandemic levels.
The growth in South Korea’s exports and imports (Fig 2) peaked in October and has been declining from the highs over the 3rd quarter, still maintaining overall momentum. The October data came after manufacturing and economic activity slowed in China and as new risks in the real estate market, e.g., Evergrande, were surfacing.
Risk actors looking into 2022 are, the Delta and Omicron variants of the coronavirus, shutdowns of key ports and factories in China and the US, GDP growth, potential implications of the geopolitical tension between Taiwan and China or the US and China and tightening tech regulations in China. All could impact trade volumes of South Korean and Taiwanese chips.
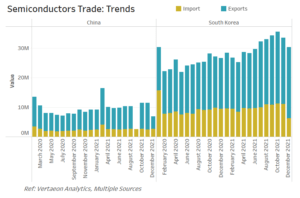 (Fig 2)
Importance of geopolitical risk factors
The semiconductor value chain is complex in that different sections, and associated sub-segment clusters, are in different parts of the globe. TSMC (at 10nm or below) and Samsung (memory chips) lead the foundries block in the value chain with 70% overall semiconductor market share. Asian companies dominate wafer production, and US companies focus on chip design. This makes it difficult to have complete supply chain resilience in one country or geography. Even integrated players have plant locations in the US, Europe, and Asia and thus face significant global risks.
Risk factors can therefore include moves to support regional investments, IP rights and protection, and local partnerships. Additionally, location-related risks can include natural disasters and pandemic impact causing local shutdowns. Strategic moves to near-shore or onshore implementation can be difficult, but can be addressed to an extent with large, focused investments over several years. Timing (of investments) risk, implementation risk and market risks will persist.
In conclusion:
We can expect a tight/strained semiconductor supply chain for the first half or all of 2022. Demand from various sectors including automotive, smartphones, laptops, and data centers should also remain strong. An added factor is the aggressive growth targets being set for the electric vehicle (EV) market. However, even with strong demand indications, companies should watch for any demand trend reversals, or inventory build-up, eventually causing a new equilibrium.
A comprehensive view into existing and potential risks are a must for understanding short and long-term value chain risks and to translate that to risk mitigation or growth opportunity identification. Vertaeon’s risk platform with 100+ risk indicators assessed in all major risk categories, and with a sector focus for semiconductor and automotive sectors, can be leveraged to minimizing profit loss and growing market share.
Author: Rekha Menon-Varma is Managing Partner at Vertaeon LLC, an advanced data analytics firm focusing on Enterprise and Supply Chain Risk and ESG analytics (SaaS tools) and insights. Vertaeon offers scalable and customizable SaaS web platforms, with easy implementation and actionable insights for decision-making.
For questions or comments please contact at https://www.vertaeon.com
*Calculated based on each of the top five companies having 1.5 million wafer starts per month, and accounting for 54% of global wafer capacity in Dec 2020, reported by eeNews Europe, Feb 2021
Disclaimer:
The content in this article is intended for informational purposes only. Vertaeon provides no endorsement and makes no representations as to accuracy, completeness, or validity of any information or content on, distributed through or downloaded, or accessed for this article. All rights and credit go to original content owners from various sources. No copyright infringement is intended. Vertaeon will not be liable for any errors, omissions, or delays in this information or any losses, injuries, or damages arising from its display or use. All information is provided on an as-is basis without any obligation to make improvements or to correct errors or omissions. Vertaeon makes no guarantees or promises regarding the sources and does not necessarily endorse or approve of their content. You may contact Vertaeon at https://www.vertaeon.com with any questions.
More Stories
What to Expect From Your First Visit to an Injury Law Office
Best ATV for Farm Work and Best UTV for Ranch Owners
UnitX Launches The World’s Fastest to Deploy AI Smart Camera to Bridge the Manufacturing Vision Gap