The mobility industry is, by definition, focused on locations and the movement of people and goods between them. However, understanding these locations and how they are connected is not always obvious. This is particularly the case with complex environments like cities where large numbers of people interact with many different transportation modes and have different needs and preferences – be it micromobility, on-demand cars, public transportation, or even walking.
Making sense of this complex network of locations can be difficult without the power of mobility intelligence which uses actual data and analyzes behavioral patterns to discover the demand.
Mobility stations site selection – Shared mobility where it’s needed
Mobility stations are required for numerous MaaS (mobility-as-a-service) solutions. Many micromobility and shared mobility solutions need to be deployed at specific sites around a city, and mass transit solutions also depend on chosen locations. Pinpointing sites with optimal demand is critical for maximizing ridership, minimizing time to ROI and ensuring the overall success of the mobility service.
The move to multimodal transportation is seen by many as a means to reach sustainability goals and to provide a better urban experience to residents and visitors alike. Therefore, it is not only MaaS companies that want the mobility service providers to succeed. City planners, departments of transportation (DOTs) and municipalities all have a stake in the successful deployment of transportation services.
Data-driven choices for locations do more than maximize ROI. They are cardinal in creating satisfaction and driving adoption. Customers that can easily find an e-scooter are much more likely to use that service.

Where to place on-demand cars, bike-sharing stations and more
There are many variables that go into the analysis and selection of the right locations. Site selection research to find optimal station placement requires data, and getting that data used to be prohibitively expensive, inaccurate and complicated.
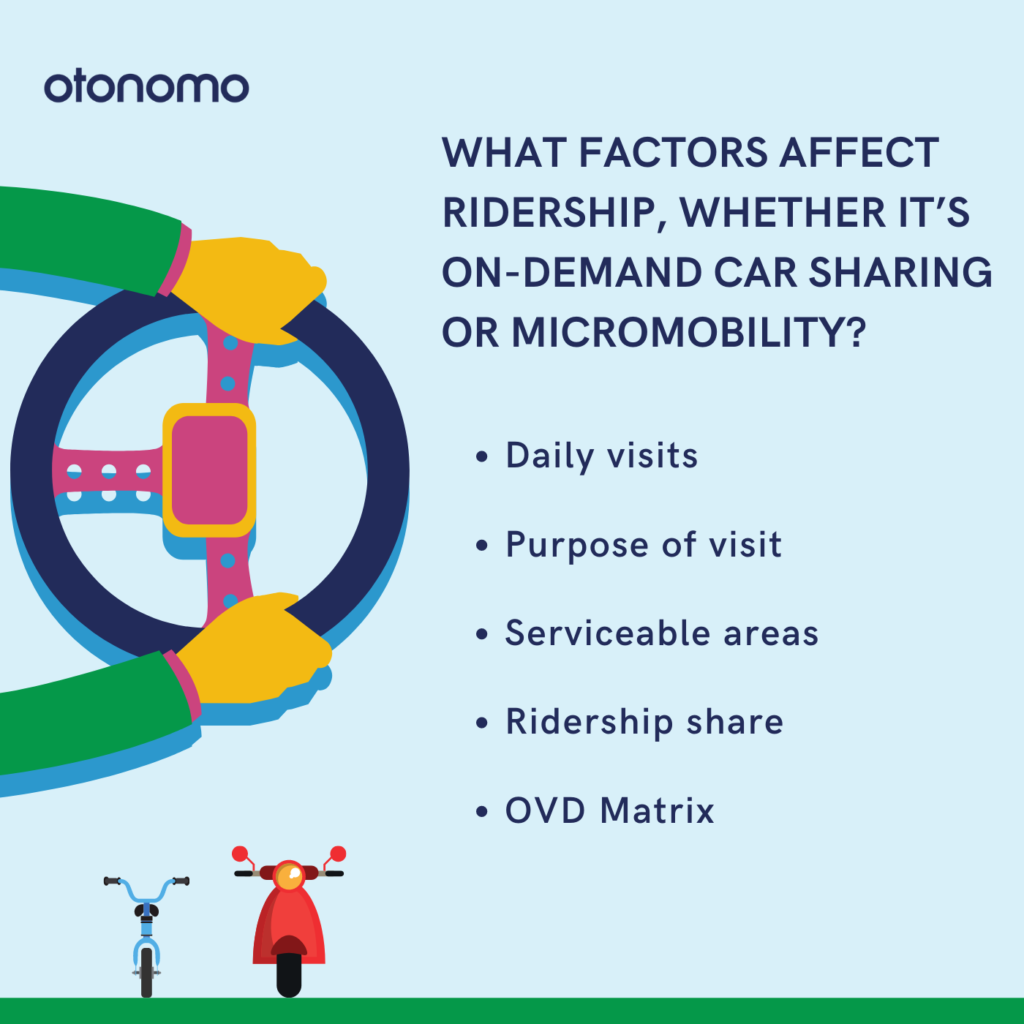
With the help of modern mobility data platforms rich data, and the application of mobility intelligence however, the many factors affecting ridership, whether it’s for on-demand car sharing or micromobility, can be taken into account. These factors may include:
- Daily visits: The total number of people visiting the location per day.
- Purpose of visit: What are people looking for (to the level of categories, brands, and even branches), and is it near the location of the mobility station at the end of the journey?
- Serviceable areas: Considering the type of transport available, what are the likely destinations for MaaS users from any given location?
- Ridership share: What percentage of total traffic is using each mode of transport? And how is that number likely to change with the introduction of new transportation modes?
- OVD Matrix: This is the origin and destination of trips and the areas through which they pass. Where are people beginning and ending their journey, and at what times?
Mobility intelligence analysis takes into account multiple factors such as population density, traffic patterns, trip parameters (origin, destination, distance, duration), driver intent, proximity to home/work, adjacent POIs, and more. Through AI and machine-learning algorithms, mobility intelligence provides a ranking that clearly prioritizes sites where demand will be highest, taking the guesswork out of the site selection process.
Read “The Essential Guide to Mobility Intelligence”to learn more about the optimizing power of mobility intelligence.


More Stories
Venti Technologies Wins Multiple Pinnacle Awards for Innovation and Achievement in Technology
Launch of AltaScient.ai: New horizons for Risk and Sustainability Analytics
Expert Tips on Detailing a Car